


Nobody’s going to call you shocking or subversive if you point out that we’re experiencing an AI bubble. And as with all financial and cultural phenomena, the temptation is to map the shape of the current boom (and its predictable end) against boom and bust cycles we’ve seen before: the dot-com bubble, the subprime mortgage crisis.
There are a couple of problems with the impulse to pattern-match here. First, we tend to misdiagnose what went wrong in previous financial crises; and some of the diagnoses which may well tip our current boom into a bust are not necessarily the ones we think they are.
Let’s put AI aside for a moment (I know, it’s hard, we’ve all become disquietingly reliant on it) and look at some of the things we think we believe about other bubbles.
If you ask Jim in the pub what caused the subprime mortgage crash, his likely response will be that house prices fell, so borrowers defaulted. Jim (and received wisdom) is wrong here. Subprime mortgage delinquencies actually started to turn upward in 2006. This happened before the crash came in 2008, not after it; mortgage defaults were rising while American house prices were also still rising.
The canonical subprime product, the 2-28 adjustable-rate mortgage, was built to be refinanced rather than repaid: you’d get two years of teaser rate, then a reset that both the borrower and the lender assumed would never arrive, because consistently and eternally rising prices would magic up the equity for the next refinance. Nearly four in five subprime hybrid ARMs written in 2003 had been refinanced away by the end of 2006. The ratchet ran on appreciation, and specifically on appreciation accelerating.
House price growth did not crash. All it had to do to break this cycle was to slow. It did: house prices were still appreciating and were still positive, but they stopped appreciating so quickly. And that was enough: the refinancing window narrowed and the defaults began. The crash arrived a year later. Jim in the pub owes me a pint.
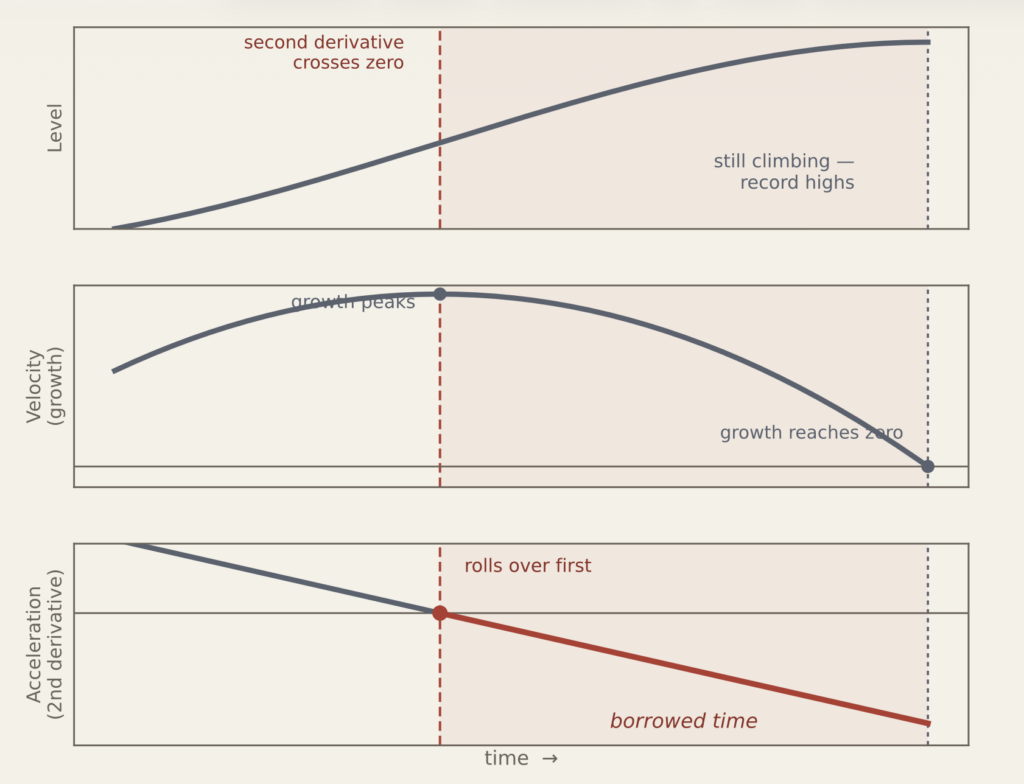
Acceleration is incredibly important in this instance. Any quantity has a level, a velocity, and an acceleration. Markets instrument the first two obsessively: sell-side models forecast levels, momentum funds trade velocity. Almost nobody positions on the acceleration, which is a mistake: it’s where you’ll find regimes changing. When financing embeds a growth assumption (a reset that presumes refinancing, a lease sized to expansion), the assumption holds only while growth continues at the assumed rate. Revenue up 40% satisfies the headline while breaking a structure built for 70%. Between acceleration rolling over and growth going negative, there’s a window of borrowed time: every chart still points up, but the carefully calibrated machine is already broken.
What about the dot-com boom? Does the AI boom look like that?
2000 was a fairly straightforward (and horrible, for those of us who got caught up in it) capital budgeting equity event, where dot-com stocks were overpriced and balance sheets were thin. Again, ask Jim in the pub what he thinks about the shape of the AI industry, and he might well tell you it looks like the same thing: a technology cycle that has resulted in a number of overpriced stocks in the sector accompanied by thin balance sheets.
And while that’s true to a degree, there’s a lot more to this current cycle. Sure, stocks are monstrously overpriced and balance sheets are just weird, but AI capital expenditure is more like the subprime mortgage crisis specifically because it’s not about capital budgeting: it’s about loans and debt.
The AI sector runs on take-or-pay capacity contracts, GPU-collateralised term loans, and asset-backed notes sold to insurers: debt-financed construction, leased to tenants, with supply arriving years after commitment. This is not a technology cycle. It’s a commercial property cycle that happens to be going on in compute, and property cycles break the same way every time: demand growth decelerates into the supply the boom has just finished building, while demand itself keeps growing.
The different ways in which the two biggest players, OpenAI and Anthropic, have structured their business models around debt and leasing point to two very different outcomes for the two organisations.
OpenAI looks a lot like the subprime mortgage borrower who will be unable to pay, and can only keep refinancing. As of the date of writing, their customer mix is not ideal: it’s 60% consumer and 40% enterprise users. (Enterprise users are stickier, have contracted seats, and tend to use the product more and pay more.) The company is not profitable: although it generates about $13b, its losses are in the tens of billions because of the very high cost of compute, research, and training new AI models. Right now, OpenAI services commitments running to hundreds of billions from a business that can’t yet cover its own burn rate, so each payment is funded by the next round pricing way above the last. The only cash flow they have is that markup. As levels, the marks are extraordinary: $86bn, $157bn, $300bn, $500bn, $852bn inside two-and-a-half years. As step-ups, the same series reads 1.83×, 1.91×, 1.67×, 1.70×, then plummets to the roughly 1.23× implied by the reported IPO target, which happens to be the lowest in the sequence, and the only one the public market gets to set. (Have you been wondering why they’re delaying their listing? There might be a clue here.)
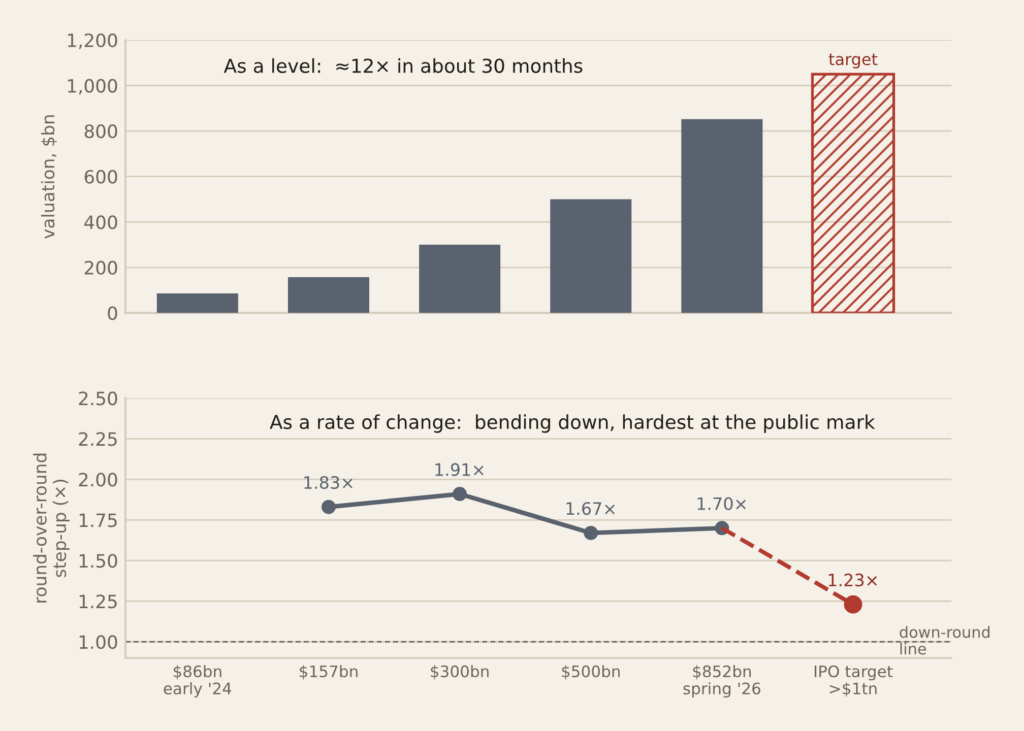
A couple of real-world factors mean that OpenAI’s rate of growth can only decelerate from this point on. Chinese open-weight models like Moonshot’s Kimi (which we’ve been using very successfully for adversarial checks on due-diligence work at Negroni) mean that the consumer/enterprise price of inferencing is plummeting; and the token-optimisation work that’s being carried out across the industry means that end-users are able to work using, and paying for, fewer tokens. Revenue’s still growing, but it’s slowing, in much the same way that US house prices did in 2006.
Anthropic, on the other hand, have a few things working in their favour in this instance (and as a fan and practitioner of business-model-hacking, I suspect there’s been a lot of thought and work put to the shape of things here which hasn’t been done anything like as well at OpenAI). Their revenue is about 80% enterprise customers, and while they’re not in profit, unit economics are looking a lot healthier than they do at OpenAI: Anthropic makes $1.70 of revenue for every dollar they spend on compute, and by next year they will get burn down to around 9% of revenue.
But the really clever bit is the way they’ve run some of their financing. Last month, Apollo and Blackstone financed a $35b private credit deal for Anthropic, which pays for their use of the Google/Broadcom’s tensor processing units (TPUs). The transaction uses an SPV to purchase TPUs, which Anthropic then leases to keep the massive hardware debt off its balance sheet. Google and Broadcom are co-signers, Google guaranteeing lease shortfalls and Broadcom guaranteeing the residual value of the silicon. This means that Anthropic’s liabilities sit behind Google and Broadcom’s guarantees (this structure, for finance nerds, is called a monoline wrap).
OpenAI does not have an equivalent co-signer. Microsoft ended its exclusivity with OpenAI and surrendered its right of first refusal in April 2026, keeping only the equity.
You can look at hyperscaler capex as origination volume: each committed gigawatt is a loan to the tenant underneath it, and the credit quality of the loan is the credit quality of the tenant. The loan book, the contracted backlog across the four big platforms (OpenAI, Google DeepMind, Anthropic and Microsoft AI), stands at roughly $2.1 trillion, and about half of it is owed by OpenAI and Anthropic. That is not a typo.
The lender’s ledger says the same thing as OpenAI’s deceleration graph above. Hyperscaler capex ran $150bn in 2023, then $226bn, $410bn, and an estimated $725bn this year; growth of 51%, 81%, 77%, 52%. Do the arithmetic on the growth itself: the acceleration went +30 points, then −4, then −25. It turned negative while every level chart still climbs.
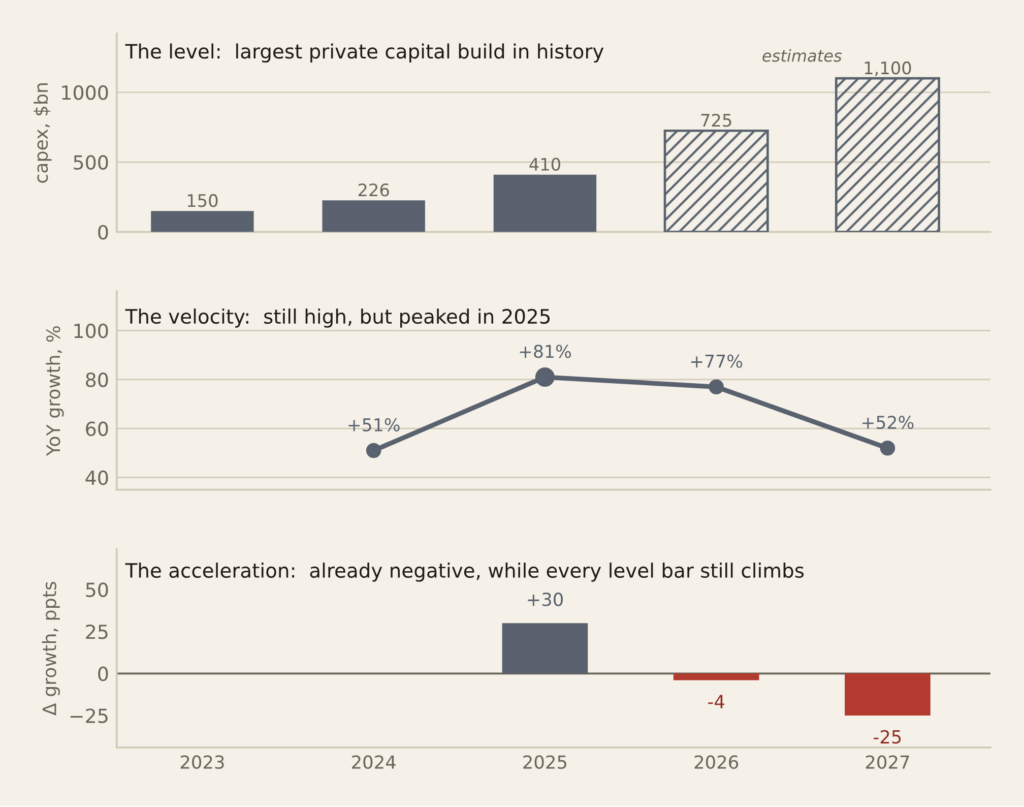
On consensus numbers capex reaches 100% of operating cash flow in 2026, past which every marginal gigawatt is funded from the balance sheet. Which is to say, the whole structure of the industry as it stands today holds only while markets reward the next borrowed dollar.
So when do things really fall apart?
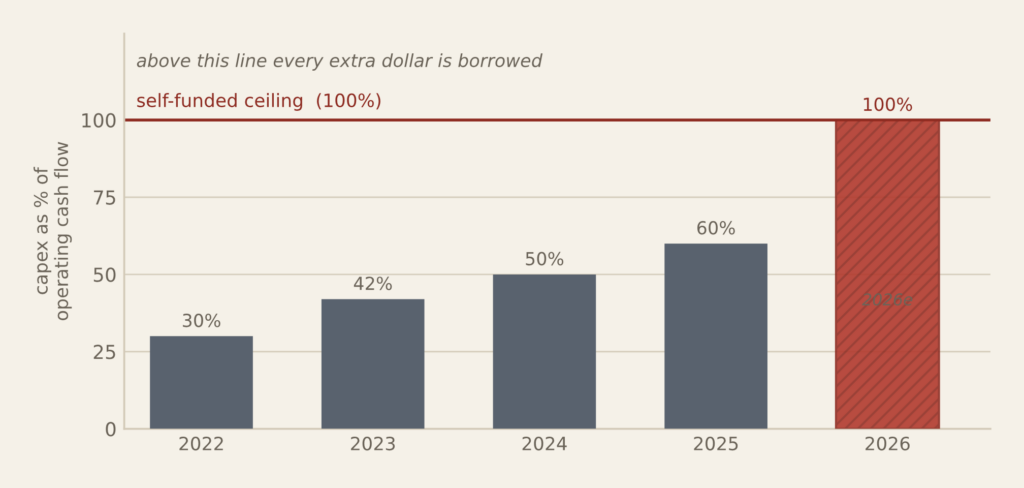
This really looks like the bubble does not burst right now, but that it’s getting perilously close to popping on the needle – which might well be made up of loan defaults. Goldman’s Delta One desk says that the first hyperscaler to decelerate spending will be rewarded for it; and that the rest will be forced to follow.
None of this requires the demand for AI to be fake or underplayed. Housing demand was real in 2006 and the machine broke anyway. Structures levered to a rate of change die on the second derivative, and this one has already turned. The defaults didn’t wait for the crash then, and this cycle won’t wait for demand to fall now. Jim in the pub should watch the acceleration, not the level.